



yum install cacti
Initial Cacti Configuration
MySQL Configuration
Cacti requires a MySQL server to be installed to function.
Check if the mysql-server package is installed on your system by running the following command:
rpm -q mysql-server
If the package is not installed, you can install it using yum by executing:
yum install mysql-server
Start the MySQL server with the command:
service mysqld start
Enter the management interface (MySQL Monitor) by running:
mysql
You should see the following prompt:
mysql>
Create a new database named cacti using the command:
create database cacti;
Exit the MySQL Monitor by typing \q.
The Cacti package includes a script that automatically creates all necessary database tables for operation.
Execute:
mysql cacti </usr/share/doc/cacti-0.8.6j/cacti.sql
Re-enter the MySQL management interface using the command:
mysql cacti
And execute the command:
mysql> show tables;
If you see the following list of tables in the database in response to this command:
+---------------------------+| Tables_in_cacti           |

+---------------------------+

| cdef                      |

| cdef_items                |

| colors                    |

| data_input                |

| data_input_data           |

| data_input_fields         |

| data_local                |

| data_template             |

| и так далее              |

+---------------------------+

48 rows in set (0.00 sec)
then you have done everything correctly; the tables have been created in the database, and you can proceed.
Now we need to grant permissions on the database we created to the user under which Cacti will connect to the server.
To do this, in the MySQL management interface, execute:
grant all on cacti.* to username@localhost identified by 'password';
This grants all privileges on the cacti database to the user username, whose access is allowed only from the host 127.0.0.1, and sets the password 'password' for this user.
To apply the assigned database privileges, you must execute the following instruction:
flush privileges;
You can now exit the MySQL Monitor.
Check that the MySQL server is enabled for automatic startup:
chkconfig --list mysqld
The command output will be approximately as follows:
mysqld 0:выкл 1:выкл 2:выкл 3:выкл 4:выкл 5:выкл 6:выкл
If you are working at runlevel 3 (which is standard for servers), add MySQL startup at this level:
chkconfig --level 3 mysqld on
Cacti Configuration
Navigate to the /etc/cacti directory and edit the db.php file, specifying the correct username and password for accessing the MySQL database.
<?php/* make sure these values refect your actual database/host/user/password */

$database_type = "mysql";

$database_default = "cacti";

$database_hostname = "localhost";

$database_username = "cacti";

$database_password = "password";

$database_port = "3306";

?>
Apache Web Server Configuration
Cacti requires an Apache server to be installed to function.
Check if the httpd package is installed on your system by running the following command:
rpm -q httpd
If the package is not installed, you can install it using yum by executing:
yum install httpd
Navigate to the /etc/httpd/conf.d directory and edit the cacti.conf file, adding the line Allow from <ip address>
Where <ip address> is the IP address of the host allowed to connect to Cacti.
That is, the cacti.conf file might look like this:
Alias /cacti    /usr/share/cacti<Directory /usr/share/cacti/>

       Order Deny,Allow

       Deny from all

       Allow from 127.0.0.1

       Allow from 10.0.0.1

</Directory>
Start the httpd service using the following command:
service httpd start
Add the httpd service to the automatic startup at your runlevel (in the example, runlevel 3):
chkconfig --level 3 httpd on
Periodic execution using Cron
Cacti collects data from all client devices using a PHP script that is executed by the system cron scheduler every 5 minutes. Therefore, for Cacti to work correctly, you need to verify that the crond daemon is running on your system.
chkconfig --list crond
As we can see, crond starts at our current runlevel (3).
crond 0:выкл 1:выкл 2:вкл 3:вкл 4:вкл 5:вкл 6:выкл
Now, check whether the crond daemon is currently running:
ps ax|grep crond
If you see something similar, it means that the daemon is currently running.
2083 ? Ss 0:00 crond
Verification of functionality
Open any browser and enter http://<ip address>/cacti/ in the address bar.
Replace <ip address> with the IP address or domain name of the machine where you installed Cacti.
If you have configured everything correctly, you should see the following in your browser window:
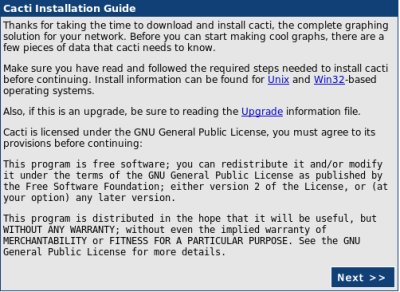
Click Next.
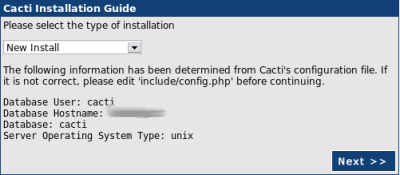
Ensure that the “New Install” option is selected and click Next.
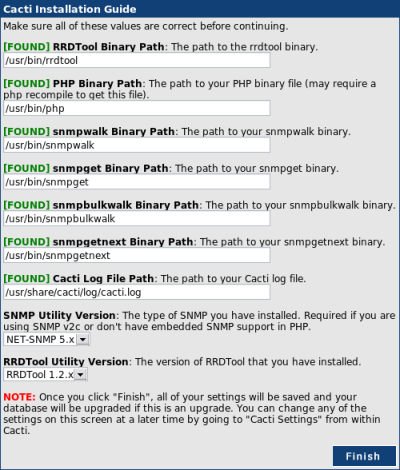
In the next window, you will be prompted to enter the paths to the utilities that Cacti uses. Leave the default values in these fields and click Finish.
The initial Cacti setup is complete. In the next window, you will be asked to enter a username and password for Cacti administration. Enter the username admin and the password admin.
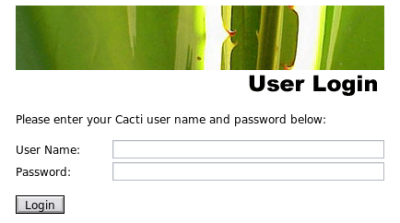
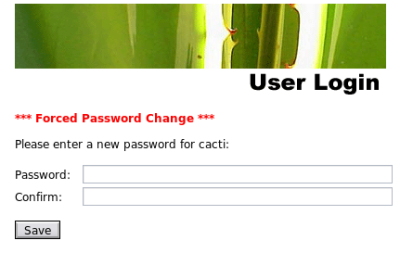
You will immediately be prompted to change the administrator password. In the next window, enter the new password and confirm it.
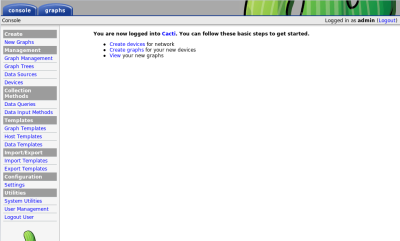
Immediately after setting the new password, you will be redirected to the Cacti management interface.
Configuring SNMP Clients
Cisco
To configure SNMP, log in to the router as a user, enter privileged mode using the “enable” command, and then execute the following:
#conf t(config)#access-list 555 permit <ip адрес>

(config)#access-list 555 deny any

(config)#snmp-server community public RO 555

(config)#exit

#write memory

#exit
Where <ip address> is the IP address of the machine with the Cacti package installed.
Linux/Unix
Ensure that the net-snmp package is installed on the Linux machine:
rpm -q net-snmp
If this package is not installed, you should install it:
yum install net-snmp
Navigate to the /etc/snmp/ directory and modify the snmp.conf file. It should look like this:
syslocation Test.syscontact INF <mail@test.ru>

#      sec.name   source          community (password)

com2sec Mybox     localhost          public

com2sec cacti     <ip адрес>     public

com2sec Outside   default            public

#      group.name sec.model  sec.name

group   RWGroup    v2c       Mybox

group   ROGroup    v1        cacti

group   ROGroup    v2c       cacti

group   Others     v2c       Outside

view all     included  .1        80

view system  included  system    fe

#              context sec.model sec.level prefix  read    write  notif

access  ROGroup   ""      any    noauth    exact   all     none   none

access  RWGroup   ""      v2c    noauth    exact   all     all    all

access  Others    ""      v2c    noauth    exact   system  none   all
Replace <ip address> with the IP address of the machine where the Cacti package is installed.
Then, execute the following command:
service snmpd start
Add the snmpd service to automatic startup at your system runlevel (in the example, runlevel 3):
chkconfig --level 3 smnpd on
Adding Data to Cacti
Adding a Cisco Host
Go to the ‘Devices’ section on the left side of the screen.
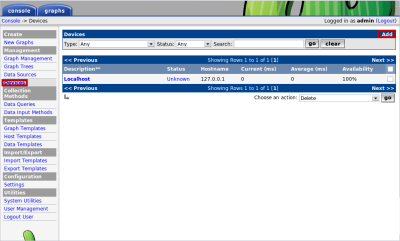
Click the ADD button to add a new device. In the window that appears
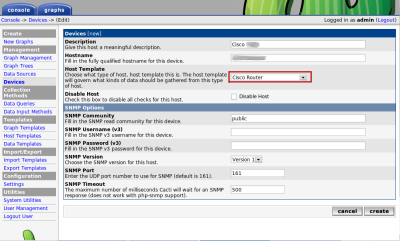
Fill in the fields as follows:
Description – Description of the router/switch, for example, Cisco XXX. Hostname – IP address of the router/switch. Host Template – From the drop-down menu, select “Cisco Router”. SNMP Parameters Block – Enter the SNMP Community name, Username, Password, Version, and SNMP Port – for more details on configuration, refer to the section “Configuring SNMP Clients” – “Cisco” in this article. After filling in all necessary parameters, click “Create”.
The host settings window has opened.
The top part of the screen displays information that Cacti was able to retrieve via SNMP. If you have not configured the equipment appropriately or entered incorrect SNMP parameters in the device settings, Cacti should display an SNMP Error message.
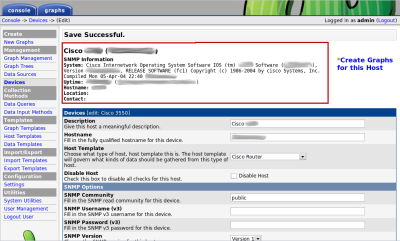
On this page, verify that the “Cisco – CPU Usage” item is already added under the “Associated Graph Templates” section and that the “SNMP – Interface Statistics” item is added under the “Associated Data Queries” section. This is because when you selected the preconfigured “Cisco Router” template for the host, the data required for display was automatically added.
Now, select the “Create Graphs for this Host” option at the top of the page.
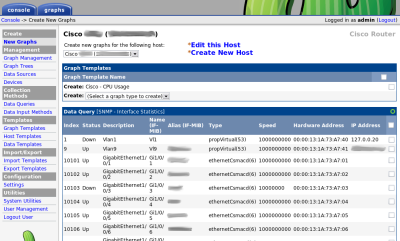
In the window that appears, select the menu items whose graphical representation you are interested in (CPU load, network interfaces).
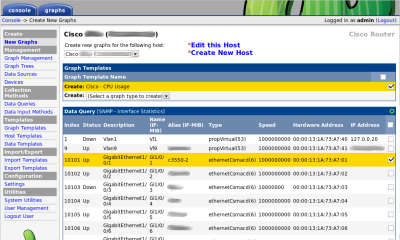
After selecting the required items, click “Create”.
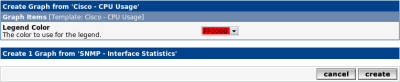
In the window that appears, you will be prompted to choose the color for the graph displaying CPU load. After selecting the desired color, click “Create”.
You will return to the host settings page, and messages indicating the successful creation of the required graphical data will appear at the top of the screen.

Now we just need to create the graphs. In Cacti, all graphical data is represented as a “tree.” By default, a tree named “Default Tree” is created. You can create your own graphical trees to group hosts based on certain criteria. In this example, we will add the newly created Cisco host to the default “Default Tree.” Go to the “Graph Trees” section on the left side of the screen. In the window that appears, select “Default Tree.”
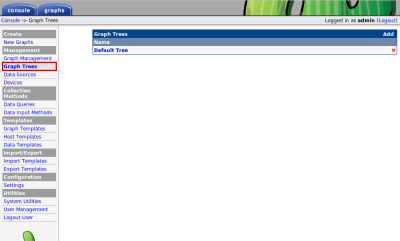
In the “Tree Items” menu, click “Add”.
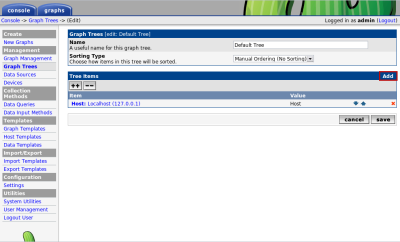
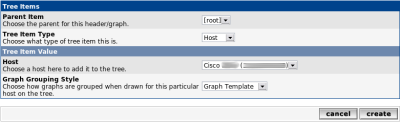
Leave “Parent Item” as “root.” In “Tree Item Type,” select “Host.” In “Host,” choose the name you assigned to your Cisco device. After filling in all fields, click “Create”.
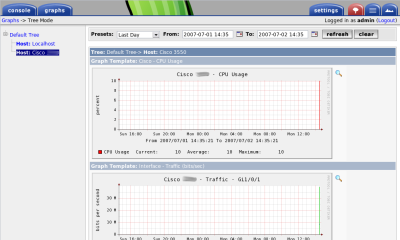
Once all necessary data has been added, you need to wait for several Cacti poller runs (it starts via cron at 5-minute intervals) for the first data to appear on the graphs.
Adding a Linux/Unix Host
Navigate to the “Devices” section on the left side of the screen.
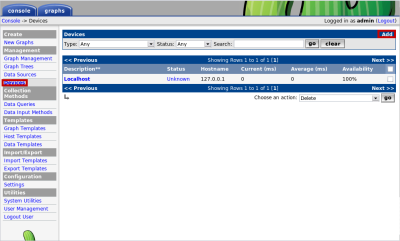
Click “Add” to add a new host. In the window that appears, fill in the fields as follows: Description – Server description. Hostname – IP address or domain name of the host. Host Template – leave this parameter set to “None”. Also, fill in the “SNMP Options” section according to the settings you configured on the monitored server, ensuring that fields such as SNMP Community, SNMP Version, SNMP Port, etc., are correctly filled out.
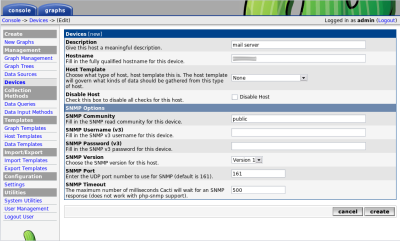
After filling in all the necessary parameters, click “Create”. A window with the settings for the newly created host will open.
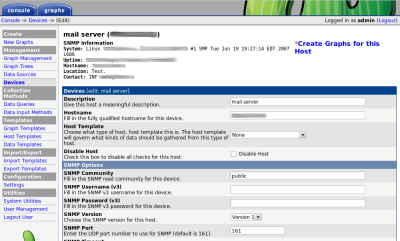
Scroll to the bottom of the screen, where you will find two sections: “Associated Graph Templates” and “Associated Data Queries”.
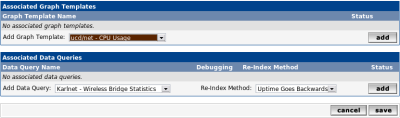
You need to add three templates to the “Associated Graph Templates” section: “ucd/net – CPU Usage”, “ucd/net – Load Average”, and “ucd/net – Load Average”. In the “Associated Data Queries” section, add “SNMP – Interface Statistics” and “SNMP – Get Mounted Partitions”.
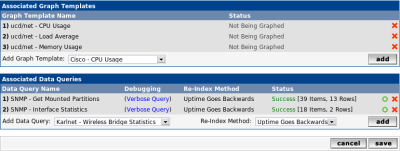
Now, select the “Create Graphs for this Host” option at the top of the page, and in the window that appears, select the necessary data for graphical display.
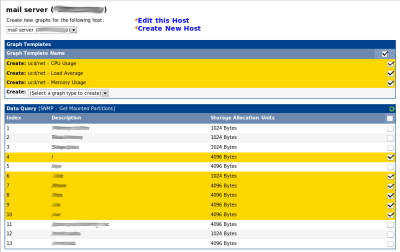
After clicking the “Create” button, the necessary data will be added.

Now go to the “Graph Trees” menu item, select the default tree “Default Tree”, and click the “ADD” button.
In the menu that appears
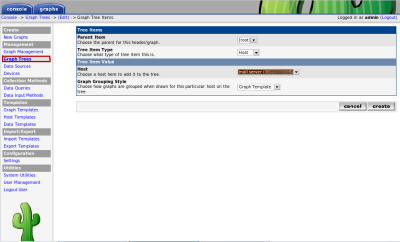
In “Parent Item”, leave “root”. In “Tree Item Type”, select the value “Host”. In “Host”, select the name you assigned to your host. After filling in all fields, click “Create”.
All graphs have been created and placed.
To view graphical data, go to the “Graphs” menu at the top of the screen and select the created host.
The article is taken from http://system-administrators.info/?p=2619
Issues I encountered:
Check if the following are installed:
[root@corp ~]# rpm -qa | grep rrd
rrdtool-1.2.23-1.el5
perl-rrdtool-1.2.23-1.el5
yum install dejavu-lgc-sans-fonts

http://www.unsam.ru/2011/01/cacti.html   - борьба с нан (если графики не рисуются)