cat /etc/redhat-release
CentOS/RHEL 7:
# rpm -Uvh http://repo.zabbix.com/zabbix/3.2/rhel/7/x86_64/zabbix-release-3.2-1.el7.noarch.rpm
yum install zabbix-agent
chkconfig zabbix-agent on
vim /etc/zabbix/zabbix_agentd.conf
#Server=zabbix.domain.ua
#ServerActive=zabbix.domain.ua
#Hostname=MyServer
#Include=/usr/local/etc/zabbix2/zabbix_agentd.d/
mkdir /etc/zabbix/zabbix_agentd.d/
service zabbix-agent start
MYSQL
mysql> GRANT USAGE ON *.* TO 'zabbix'@'%' IDENTIFIED BY 'mypass';
FLUSH PRIVILEGES;
vim /etc/zabbix/zabbix_agentd.d/userparameter_mysql.conf
UserParameter=mysql.status[*],echo "show global status where Variable_name='$1';" | HOME=/var/lib/zabbix mysql -N | awk '{print $$2}'
UserParameter=mysql.size[*],bash -c 'echo "select sum($(case "$3" in both|"") echo "data_length+index_length";; data|index) echo "$3_length";; free) echo "data_free";; esac)) from information_schema.tables$([[ "$1" = "all" || ! "$1" ]] || echo " where table_schema=\"$1\"")$([[ "$2" = "all" || ! "$2" ]] || echo "and table_name=\"$2\"");" | HOME=/var/lib/zabbix mysql -N'
UserParameter=mysql.ping,HOME=/var/lib/zabbix mysqladmin ping | grep -c alive
UserParameter=mysql.version,mysql -V
vim /etc/zabbix/.my.cnf
[mysql]
user=zabbix
password=*****
[mysqladmin]
user=zabbix
password=*****
service zabbix-agent restart
NG
The nginx server is capable of providing part of the information about its state that we need. To do this, it must be properly configured. Open the server configuration file and add the following block:
server {
        listen localhost;
        server_name status.localhost;
        keepalive_timeout 0;
        allow 127.0.0.1;
        deny all;
        location /server-status {
                 stub_status on;
        }
        access_log off;
}
Save the configuration and restart nginx, having first checked the configuration file for errors:
# nginx -t
# systemctl restart nginx
Check whether we can retrieve the required information:
# wget http://localhost/server-status
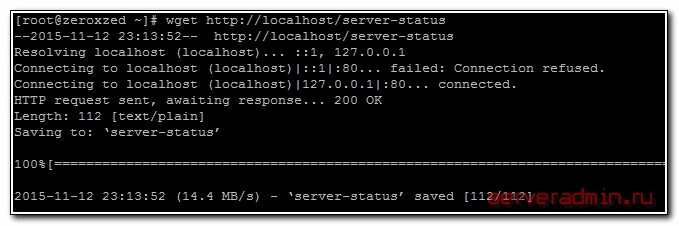
A file named server-status should appear in the current directory with content similar to the following:
# cat server-status
Active connections: 3
server accepts handled requests
156171 156171 318790
Reading: 0 Writing: 1 Waiting: 2
If you see the same, everything is fine and you can proceed. If something is not working, check the configuration files and review the logs. This is standard functionality, so it should be configured and work without issues.
Configuring Zabbix monitoring for nginx
We will parse the obtained server-status file using a script. To run it, you need to install a couple of packages:
# yum -y install curl zabbix-sender
Create a directory where our monitoring scripts will be stored:
# mkdir /etc/zabbix/scripts
And place the nginx.sh script with the following content there:
#!/bin/sh

PREFIX='nginx'
URL='http://127.0.0.1/server-status'

CURL='/usr/bin/curl'
TMP='/tmp/nginx-ping.tmp'
SENDER='/usr/bin/zabbix_sender'
CONFIG='/etc/zabbix/zabbix_agentd.conf'

if [ ! -x ${CURL} ]
then echo Seems, path to curl is incorrect or not installed. && exit 0
else if [ ! -x ${SENDER} ]
then echo Seems, path to zabbix_sender is incorrect or not installed. && exit 0
else if [ ! -f ${CONFIG} ]
then echo Seems, path to zabbix_agentd.conf is incorrect && exit 0
fi fi fi

read -a s <<< `(time ${CURL} --no-keepalive -s -m 9 ${URL}) 2>$TMP`

if [[ "${s[7]}" =~ ([0-9]+) ]]
then
echo "\
- ${PREFIX}.accepts ${s[7]}
- ${PREFIX}.connections.active ${s[2]}
- ${PREFIX}.connections.reading ${s[11]}
- ${PREFIX}.connections.waiting ${s[15]}
- ${PREFIX}.connections.writing ${s[13]}
- ${PREFIX}.handled ${s[8]}
- ${PREFIX}.requests ${s[9]}" | ${SENDER} -c ${CONFIG} -i - >/dev/null 2>&1
awk '/real/{split($2,a,"[ms]");print a[1]*60+a[2];}' $TMP
else
echo '-0.001'
fi
rm $TMP
exit 1
Make it executable:
# chmod 0645 nginx.sh
Now open the Zabbix agent configuration file and add a user parameter:
# mcedit /etc/zabbix/zabbix_agentd.conf
UserParameter=nginx.ping,/etc/zabbix/scripts/nginx.sh
Restart the agent:
# systemctl restart zabbix-agent
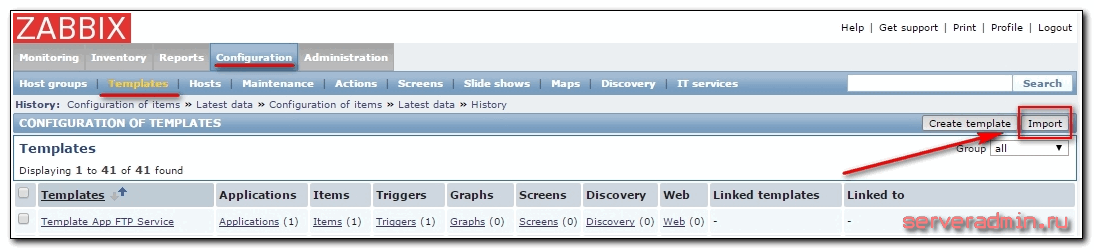
Next, we need to add a new monitoring template. Download it from nginx.xml and open the Zabbix web interface. Go to the Configuration -> Templates section and click Import:
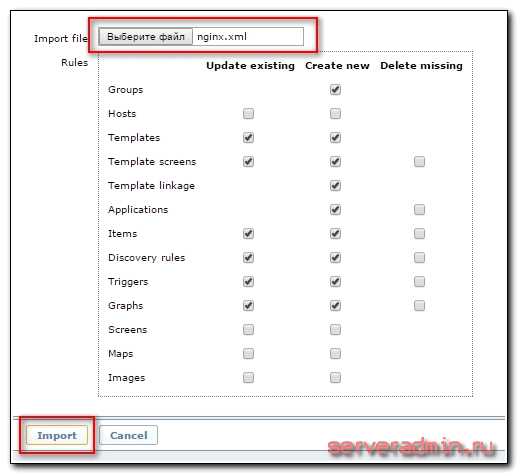
Select the file and click Import again:
Almost everything is ready. Now we need to attach the added template to the web server we are monitoring. Go to Configuration -> Hosts, select the required server, open the Templates tab, and link the template:
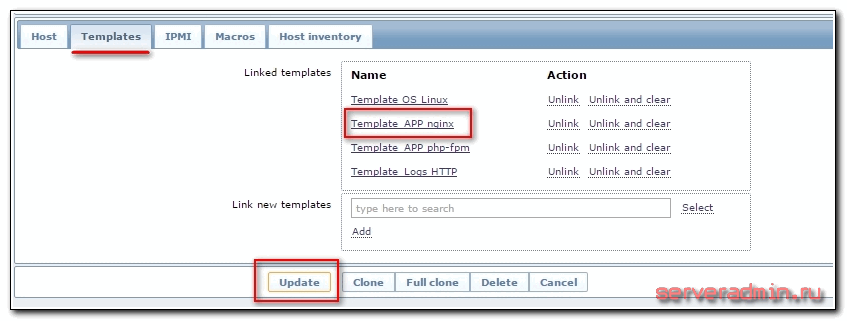
Click Update and wait for new data to arrive. You can check it in Monitoring -> Latest Data:
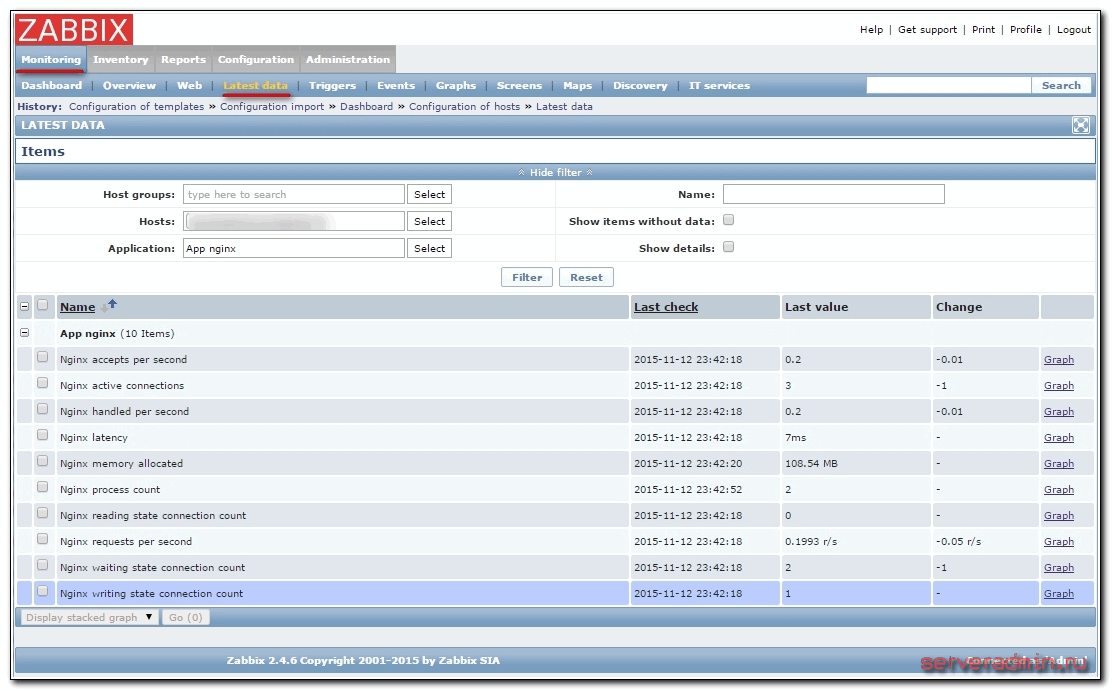
The template already includes several triggers and graphs. You can view and edit them in the template properties or in the properties of an individual host. I prefer to create Screens with the necessary set of graphs. Here is what my nginx monitoring dashboard looks like:
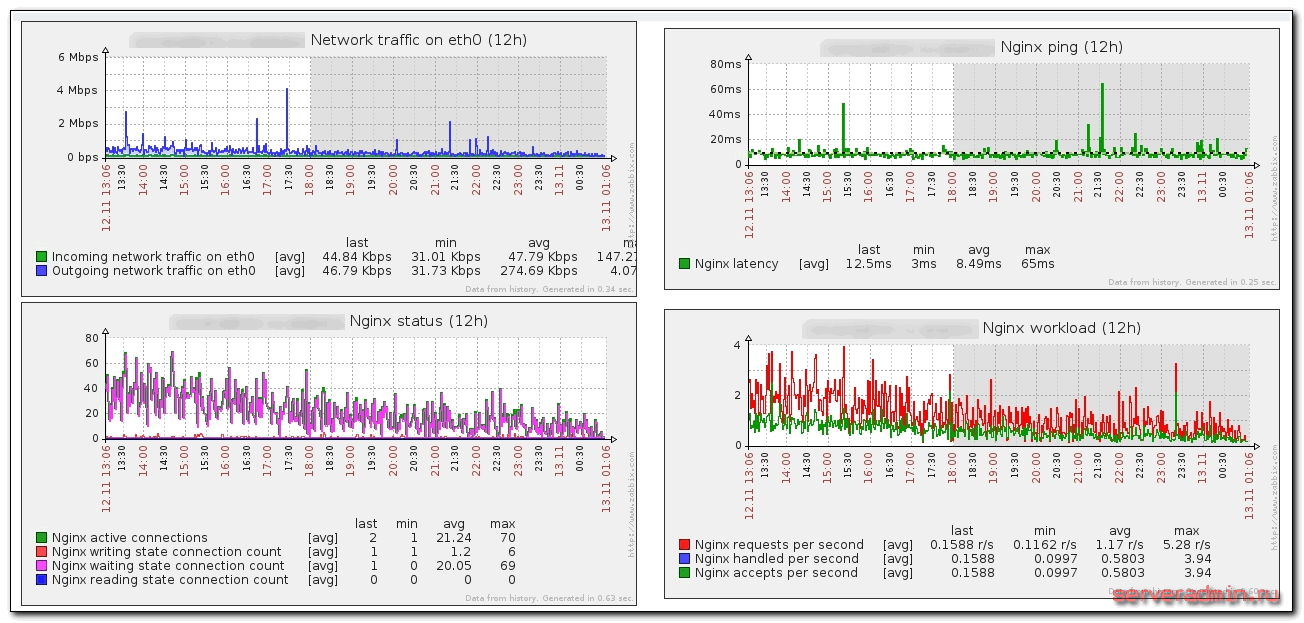
This completes the nginx monitoring setup; you can now use it.
Preparing php-fpm for monitoring
We will monitor the following php-fpm parameters:
| active processes count | Number of active processes |
| connections per sec | Number of connections per second |
| idle processes count | Number of idle processes |
| latency | Response time in milliseconds |
| length of listen queue | Size of the pending connections queue |
| max children reached | Number of times the process limit was reached |
| max length of listen queue | Maximum size of the connections queue |
A few words on why this is needed and how to use the collected data. This monitoring is relevant if you have dynamic process creation in php-fpm. For example, if the value of max children reached is regularly greater than one, it is recommended to increase the limit on the maximum number of processes, provided that the server resources allow it. The same applies to the length of listen queue parameter. If it is greater than zero, a queue of requests is created that the server cannot process in time. You need to increase the number of processes that can handle pending connections.
You should pay attention to the latency parameter. If it is regularly greater than 10-20 ms, you need to figure out why the server is responding so slowly. The rest of the information is just for statistics.
Let's start configuring. Install fcgi:
# yum -y install fcgi
Now prepare php-fpm to collect statistics. For this, we will use nginx again. Edit its configuration file, adding the following structure to the same server section as in the previous step:
location /status {
access_log off;
allow 127.0.0.1;
deny all;
include fastcgi_params;
fastcgi_pass unix:/var/run/php-fpm/php5-fpm.sock;
fastcgi_param SCRIPT_FILENAME $document_root$fastcgi_script_name;
}
Restart nginx:
# systemctl restart nginx
Make the necessary changes to the php-fpm configuration file — add one line:
# mcedit /etc/php-fpm.d/www.conf
pm.status_path = /status
Restart php-fpm:
# systemctl restart php-fpm
Check that we get php-fpm statistics at the specified address:
# wget http://127.0.0.1/status
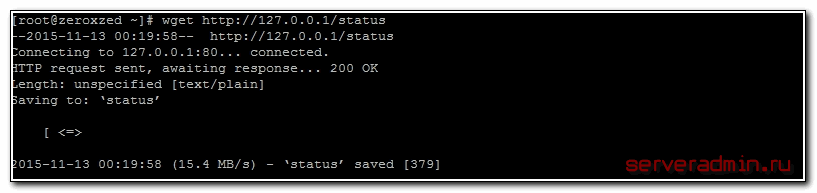
Look at the contents of the status file:
# cat status

pool: www
process manager: dynamic
start time: 10/Nov/2015:00:44:55 +0300
start since: 257703
accepted conn: 47066
listen queue: 0
max listen queue: 0
listen queue len: 0
idle processes: 7
active processes: 1
total processes: 8
max active processes: 40
max children reached: 1
slow requests: 0
If you have approximately the same output, then everything is fine, php-fpm is providing information about its state.
Configuring php-fpm monitoring in Zabbix
Now prepare a script for Zabbix to process the collected status:
# mcedit /etc/zabbix/scripts/php-fpm.sh
#!/bin/sh

PREFIX='php.fpm'
URL='http://127.0.0.1/status'

CURL='/usr/bin/curl'
TMP='/tmp/php-fpm-ping.tmp'
SENDER='/usr/bin/zabbix_sender'
CONFIG='/etc/zabbix/zabbix_agentd.conf'

if [ ! -x ${CURL} ]
then echo Seems, path to curl is incorrect or not installed. && exit 0
else if [ ! -x ${SENDER} ]
then echo Seems, path to zabbix_sender is incorrect or not installed. && exit 0
else if [ ! -f ${CONFIG} ]
then echo Seems, path to zabbix_agentd.conf is incorrect && exit 0
fi fi fi

(time ${CURL} --no-keepalive -sm3 ${URL}) 2>$TMP | awk --assign pr="- ${PREFIX}." '
/^accepted c/ {print pr"accepted_conn "$3}
/^active proc/ {print pr"active_processes "$3}
/^idle proc/ {print pr"idle_processes "$3}
/^listen queue:/ {print pr"listen_queue_len "$3}
/^max children reach/ {print pr"max_children_reached "$4}
/^max listen queue:/ {print pr"max_listen_queue_len "$4}' | ${SENDER} -c ${CONFIG} -i - 2>/dev/null | awk --assign t="${TMP}" '/^sent/{if($6==0){print"-0.001";print>t}}'
awk '/real/{split($2,a,"[ms]");print a[1]*60+a[2];}' $TMP
rm $TMP
exit 1
Make it executable:
# chmod 0645 php-fpm.sh
Add another user parameter to the Zabbix agent configuration:
# mcedit /etc/zabbix/zabbix_agentd.conf
UserParameter=php.fpm.ping,/etc/zabbix/scripts/php-fpm.sh
Restart the agent:
# systemctl restart zabbix-agent
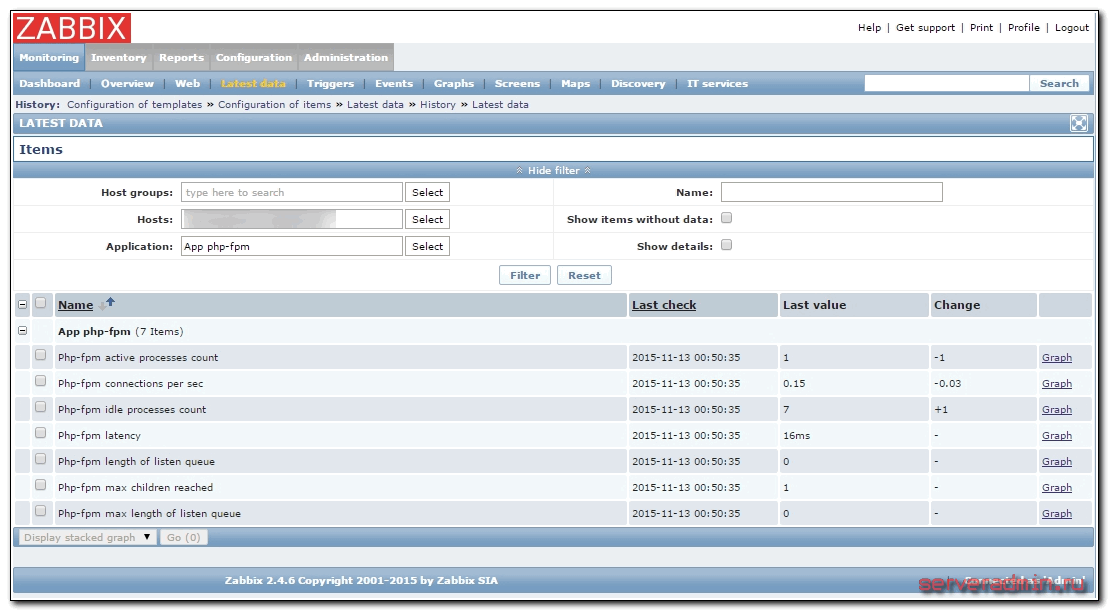
Next, as in the case with nginx, go to the web interface and import the php-fpm.xml template. Add this template to the required server and wait for the data to update. Check for their arrival as usual in Monitoring -> Latest Data:
If everything is in order, check the graphs and create the Screen you need. Mine looks like this:
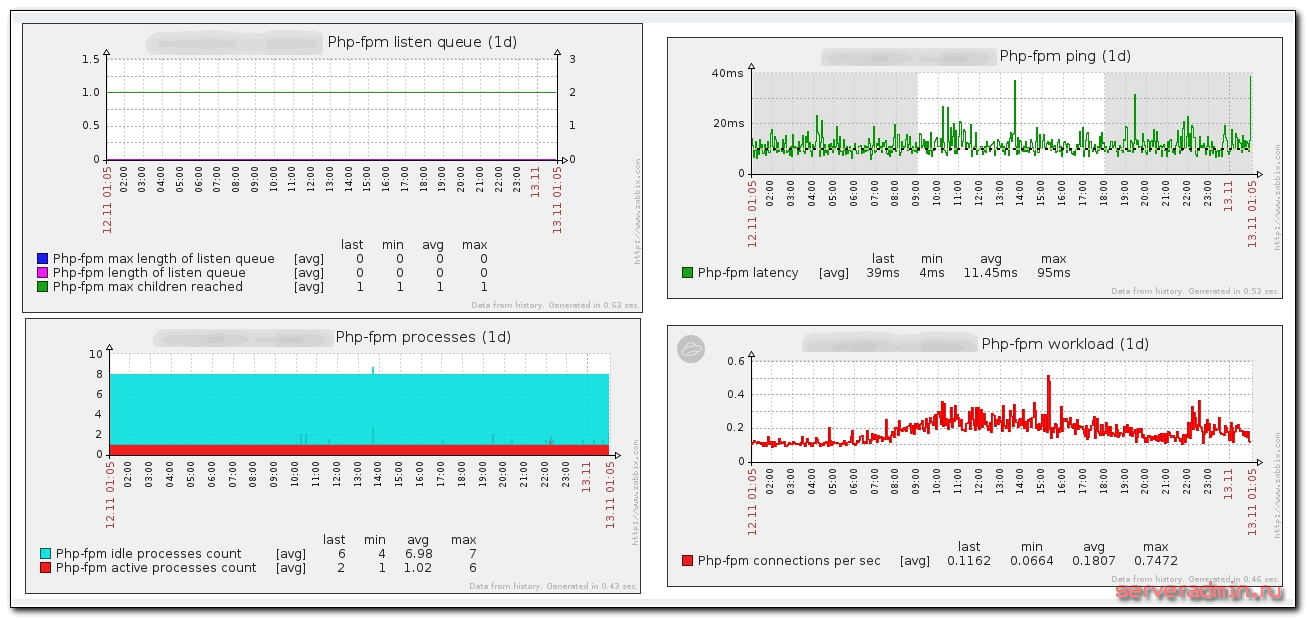
The template already has 3 triggers configured, which activate when:
- the php-fpm service goes down
- the number of worker processes is less than 3
- the response time is less than 10 ms over the last 10 measurements
The second trigger can be removed or modified if you have fewer than the minimum number of worker processes.
Conclusion
Let's summarize what we have done:
- Configured the nginx server to provide information about its status and the status of the php-fpm service.
- Created scripts to process information from the web server and pass it to Zabbix.
- Configured the Zabbix agent to send processed data to the server using user parameters.
- Created the necessary templates on the monitoring server and attached them to the monitored servers.
- Combined the monitored parameters into a Screen for convenient observation.
In other words, we performed the entire set of actions required to organize full-fledged monitoring of a web server based on nginx + php-fpm in Zabbix.
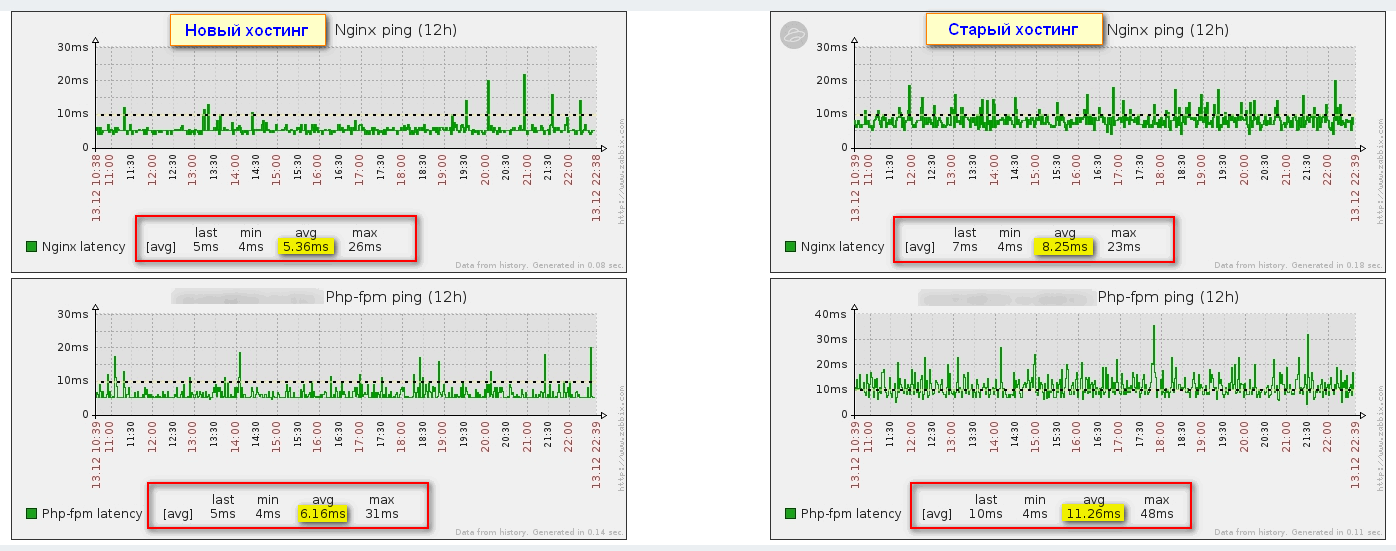
One application of such monitoring is choosing a faster hosting provider for your website. For example, some time ago I needed to change hosting. But how to find out if it will be faster than the current one or not? The specifications are roughly the same for everyone. I simply took a trial period, configured everything I needed on the server, including web server monitoring, moved the site there, and observed it for a day. Based on the response times of nginx and php-fpm, it became clear to me that the new hosting was faster: